
Most supply chain leaders know SAP IBP improves forecast accuracy. Few know exactly why —or how that accuracy translates directly into a lower safety stock number on the warehouse floor.
Excess inventory is expensive. It ties up working capital, creates write-off risk, and signals a planning process that is reacting rather than anticipating. For most companies, the root cause is the same: forecast error that is either too high, biased in one direction, or invisible until it is too late to act.
SAP Integrated Business Planning (IBP) addresses this through five distinct mechanisms each targeting a different source of inaccuracy. This article explains how they work, in plain terms and with the underlying formula that connects forecast accuracy to inventory levels.
Forecasting demand can often feel like trying to predict the weather by looking out the window of a moving train. Traditional forecasting methods usually rely on historical data, disjointed spreadsheets, and a lot of gut feeling. The result? Stockouts, bloated inventory, and missed financial targets.
This is where Integrated Business Planning (IBP) steps in. IBP isn’t just a software tool or an upgraded Sales and Operations Planning (S&OP) process; it is a comprehensive framework that aligns an organization’s strategic, operational, and financial plans.
Replacing lag with real-time signal
Traditional statistical forecasting looks backward at 12–24 months of order history and projects forward. The problem is structural: customer orders reach the planner days or weeks after actual consumer demand occurs.
In many companies, the “consensus” forecast is highly political. Sales teams might inflate numbers to secure inventory or deflate them to guarantee bonuses. Finance wants a conservative, low-risk number, while Supply Chain begs for a stable number to manage manufacturing.
Traditional forecasts rely heavily on last year’s actuals. If there is a sudden market shift, a supply chain disruption, or a spike in inflation, historical data becomes instantly obsolete.
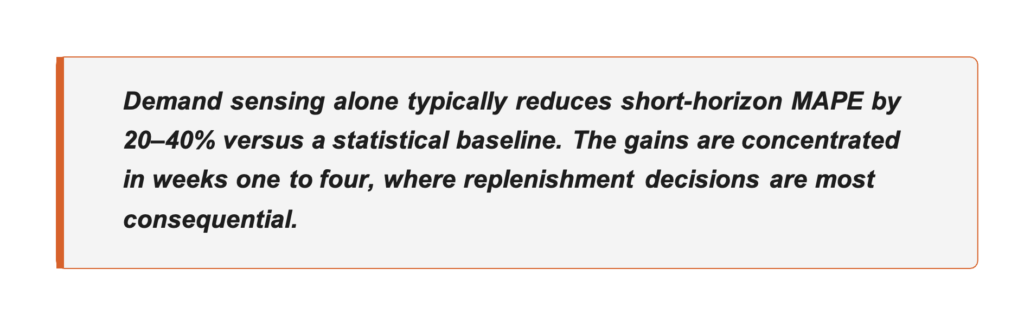
IBP’s demand sensing module replaces the statistical baseline with a real-time signal blend for the near-term horizon (typically one to eight weeks out). It ingests point-of-sale data, customer shipment actuals, and distribution centre movement data — what is genuinely selling, not what someone ordered after it sold.
No single algorithm wins across all SKUs
IBP does not force a single forecast algorithm across the product portfolio. It runs multiple models in parallel ARIMA variants, exponential smoothing, regression trees, and in recent versions, neural time series models and weights or selects the best performer based on historical accuracy scoring.
This matters because no single model type wins across all product categories. High-volume stable products tend to favour exponential smoothing. Seasonal or trend-driven products suit ARIMA or STL decomposition. Sparse, intermittent demand common in spare parts and industrial supply chains is handled by Croston or Teunter-Syntetos-Babai methods. The ensemble removes the burden of manual model selection from planners, and auto-retrains when accuracy deteriorates.
Removing systematic bias from history
Raw historical demand data is distorted. A promotion 18 months ago inflated volume. A price increase suppressed it. A stockout meant the business could not sell even when demand existed. Feeding biased history into a statistical model produces a biased forecast — one that consistently over- or under-predicts in predictable ways.
IBP’s causal factor engine allows planners to configure uplift drivers promotions, price elasticity, cannibalization effects, public holidays and mathematically strips those effects from the baseline before forecasting. The result is abaseline that reflects true underlying demand. This is the primary mechanism for reducing forecast bias, as distinct from random error.
Directing human judgment where it matters
Even the best algorithm produces errors on specific items. IBP continuously monitors forecast accuracy and flags where error exceeds configured thresholds. Planners see a ranked exception list rather than reviewing every line in a spreadsheet.
IBP completely rewrites the rules of forecasting by introducing cross-functional collaboration, advanced technology, and a focus on external market realities.
The practical impact is significant. Without a structured exception process, planners spread their attention evenly and miss the items that move the needle.
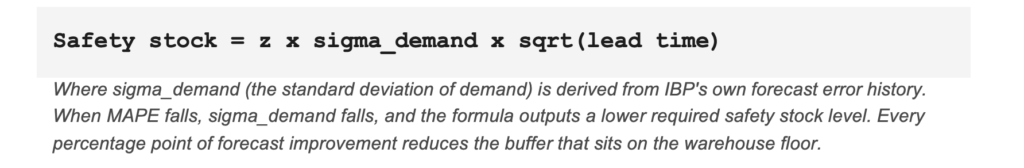
Where the formula becomes real
This is the mechanism that connects forecast accuracy directly to inventory reduction — not as a soft benefit, but as a mathematical consequence.
Beyond the formula, IBP’s inventory optimisation capability implements multi-echelon inventory optimisation (MEIO). It models the entire supply network factories, regional distribution centres, local DCs, and customer-facing locations and determines the optimal stocking level and position at each node simultaneously.
The typical finding: companies hold redundant safety stock at multiple tiers as a precaution, when holding more at a central node and less at the extremities achieves the same service level with significantly less total inventory. Industry benchmarks for companies implementing IBP fully typically cite 10–25% inventory reduction alongside the forecast accuracy gains.
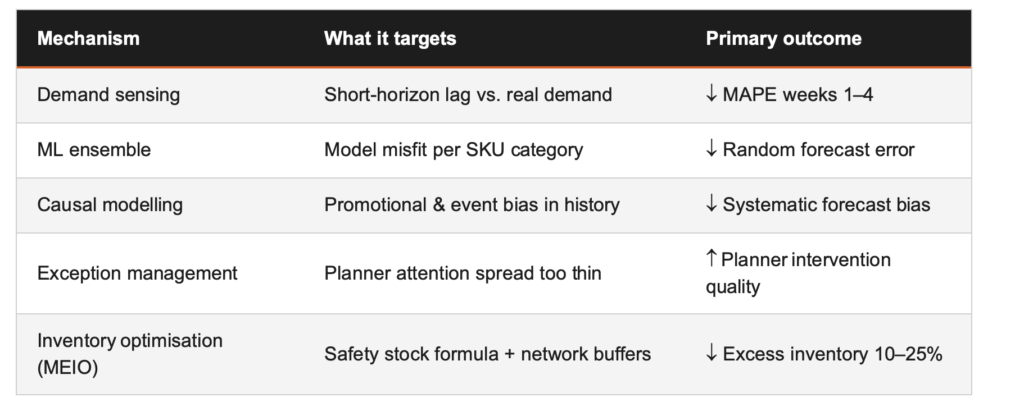
Five mechanisms, two outcomes
The important caveat
IBP’s algorithms are only as good as the data quality and the process discipline surrounding them. Companies that install the software without redesigning their S&OP; process — without creating a genuine consensus forecasting cycle with commercial, finance, and operations aligned — rarely capture the full benefit. The technology is an enabler. The planning process is the differentiator.
For supply chain organisations considering IBP, the right question is not ‘does IBP reduce inventory?’ the answer is well evidenced. The right question is: ‘what does our data quality and process maturity need to look like before the algorithms can deliver?’ That is where the real implementation work happens.